
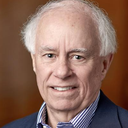
Mason Hawkins
Southeastern Asset Management Inc | CIK: 0000807985
Filing Date
Aug 14, 2026
Market Value
$1.78B
Holdings
42
Turnover
11.91%
Avg. Hold (Top 20)
19.05 Qtrs
Buys
2
Sells
7
Q2 2026 Holdings
| Holding | Asset Type | Portfolio % | Recent Activity | Shares | Market Value | AVG Price Paid | Current Price | Performance | |
|---|---|---|---|---|---|---|---|---|---|
| RYN Rayonier | Stock | 10.12% | Reduced 11.81% | 9.49M | $180.05M | $23.32 | $18.97 | -18.65% | |
| MAT Mattel | Stock | 12.00% | Reduced 3.82% | 12.32M | $213.43M | $17.39 | $17.32 | -0.42% | |
| CNX CNX Resources | Stock | 9.08% | Added 16.17% | 4.66M | $161.43M | $25.62 | $34.62 | +35.13% | |
IAC IAC InterActive | - | 8.13% | Reduced 22.15% | 3.13M | $144.53M | $69.44 | $46.15 | -33.54% | |
| REGN Regeneron Pharmaceuticals | Stock | 6.82% | Added 16.58% | 152.32K | $121.3M | $653.98 | $796.34 | +21.77% | |
| ACI Albertsons Companies | Stock | 6.33% | Added 16.39% | 8.64M | $112.53M | $18.33 | $13.03 | -28.91% | |
| ABT Abbott Laboratories | Stock | 4.95% | Bought | 840.75K | $88.02M | $91.18 | $104.69 | +14.82% | |
| KHC The Kraft Heinz Company | Stock | 4.72% | Reduced 8.63% | 3.61M | $83.99M | $29.62 | $23.28 | -21.40% | |
| GLIBK GCI Liberty | Stock | 2.24% | Added 46.50% | 1.94M | $39.87M | - | - | - | |
| FDX FedEx | Stock | 3.24% | Reduced 36.57% | 194.83K | $57.58M | $148.34 | $295.54 | +99.23% | |
| AVTR Avantor | Stock | 4.28% | Added 34.24% | 4.73M | $76.03M | $11.73 | $16.09 | +37.12% | |
| PVH PVH | Stock | 3.02% | Reduced 14.52% | 629.9K | $53.79M | $77.49 | $85.39 | +10.20% | |
| MGM MGM Resorts International | Stock | 1.94% | Reduced 29.67% | 1.17M | $34.48M | $26.56 | $29.48 | +11.00% | |
| ESRT Empire State Realty Trust | Stock | 2.31% | Added 34.34% | 8.7M | $41.13M | $6.87 | $4.73 | -31.14% | |
| WTM White Mountains Insurance | Stock | 2.07% | Reduced 9.33% | 17.1K | $36.75M | $1350.87 | $2148.50 | +59.05% | |
| GHC Graham Company | Stock | 1.97% | Reduced 22.79% | 29.16K | $34.95M | $516.20 | $1198.75 | +132.22% | |
| SHEN Shenandoah Telecommunications Company | Stock | 1.51% | Reduced 11.00% | 2.62M | $26.77M | $12.28 | $10.23 | -16.69% | |
| FIS Fidelity National Information Services | Stock | 1.56% | Reduced 7.05% | 769.14K | $27.79M | $58.03 | $36.13 | -37.74% | |
| CLW Clearwater Paper | Stock | 1.67% | Added 0.92% | 1.54M | $29.71M | $23.15 | $19.30 | -16.62% | |
| BATRK Atlanta Braves | Stock | 1.68% | Reduced 9.82% | 605.09K | $29.9M | $21.15 | $49.41 | +133.61% | |
| SAM The Boston Beer Company | Stock | 1.47% | Added 23.35% | 146.04K | $26.17M | $284.40 | $179.20 | -36.99% | |
| ALX Alexander's | Stock | 1.31% | Unchanged | 99.01K | $23.24M | $227.65 | $234.68 | +3.09% | |
| TRIP Tripadvisor | Stock | 1.19% | Reduced 50.88% | 2.26M | $21.21M | $13.47 | $9.39 | -30.28% | |
| DOLE Dole plc | Stock | 1.32% | Reduced 9.39% | 1.75M | $23.5M | $13.23 | $13.41 | +1.33% | |
| TME Tencent Music Entertainment | Stock | 1.12% | Bought | 2.31M | $19.94M | $9.14 | $8.65 | -5.41% | |
| MICC The Magnum Ice Cream Company | Stock | 1.04% | Reduced 38.16% | 1M | $18.47M | $15.61 | $18.44 | +18.15% | |
| SN SharkNinja | Stock | 0.69% | Reduced 74.77% | 63.23K | $12.25M | $48.21 | $193.68 | +301.74% | |
| ACMR ACM Research | Stock | 0.46% | Reduced 82.18% | 139.48K | $8.1M | $25.24 | $58.09 | +130.13% | |
| MLCO Melco Resorts & Entertainment | Stock | 0.39% | Reduced 10.54% | 1.61M | $6.95M | $7.11 | $4.32 | -39.25% | |
| HTHT H World | Stock | 0.53% | Reduced 11.10% | 205.68K | $9.45M | $34.38 | $45.94 | +33.61% | |
| AMG Affiliated Managers | Stock | 0.12% | Unchanged | 5.56K | $2.13M | $135.74 | $383.04 | +182.18% | |
| CAH Cardinal Health | Stock | 0.10% | Unchanged | 7.34K | $1.86M | $62.00 | $253.71 | +309.19% | |
| LYV Live Nation Entertainment | Stock | 0.08% | Unchanged | 8.43K | $1.45M | $77.57 | $172.51 | +122.39% | |
| HSIC Henry Schein | Stock | 0.08% | Unchanged | 17.04K | $1.48M | $69.12 | $86.99 | +25.85% | |
| H Hyatt Hotels | Stock | 0.07% | Unchanged | 7.73K | $1.31M | $66.30 | $168.91 | +154.76% | |
| PYPL PayPal | Stock | 0.07% | Unchanged | 22.46K | $1.28M | $61.21 | $57.16 | -6.61% | |
| XPO XPO Logistics | Stock | 0.07% | Unchanged | 6.34K | $1.2M | $56.53 | $188.83 | +234.04% | |
| MSGS Madison Square Garden Sports | Stock | 0.07% | Unchanged | 3.22K | $1.3M | $180.64 | $404.66 | +124.01% | |
| ENOV Enovis | Stock | 0.05% | Unchanged | 44.26K | $856.39K | $41.60 | $19.35 | -53.48% | |
| RXO RXO | Stock | 0.07% | Unchanged | 43.73K | $1.27M | $18.17 | $29.06 | +59.97% | |
| LAZ Lazard Inc | Stock | 0.04% | Unchanged | 18.61K | $672.87K | $38.87 | $36.16 | -6.98% | |
| HDB HDFC Bank | Stock | 0.01% | Unchanged | 10.46K | $246.17K | $28.46 | $23.53 | -17.31% |
Sold Positions (100% Exited)
| Company | Asset Type | Shares Sold | Status |
|---|---|---|---|
Gci Liberty Inc | - | -80.68K | 100% Sold |
| BIO Bio Rad Labs Inc | Stock | -162.8K | 100% Sold |
| EDU New Oriental Ed & Technology | Stock | -522.28K | 100% Sold |
KKS.F Kaspi Kz Jsc | - | -240.63K | 100% Sold |
| STZ Constellation Brands Inc | Stock | -3.66K | 100% Sold |
| CLVT Clarivate Plc | Stock | -121.93K | 100% Sold |
| FISV Fiserv Inc | Stock | -3.99K | 100% Sold |
Sector Breakdown
| Sector | Weight |
|---|---|
Consumer Cyclical | 19.84% |
Healthcare | 16.28% |
Consumer Defensive | 14.88% |
Real Estate | 13.74% |
Energy | 9.08% |
Communication Services | 6.70% |
Industrials | 5.34% |
Financial Services | 2.31% |
Technology | 2.02% |
Basic Materials | 1.67% |
Industry Breakdown
| Industry | Weight |
|---|---|
Leisure | 12.00% |
REIT - Specialty | 10.12% |
Oil & Gas Exploration & Production | 9.08% |
Biotechnology | 6.82% |
Grocery Stores | 6.33% |
Packaged Foods | 5.76% |
Medical - Devices | 5.00% |
Medical - Instruments & Supplies | 4.28% |
Telecommunications Services | 3.75% |
Integrated Freight & Logistics | 3.24% |
Apparel - Manufacturers | 3.02% |
Gambling, Resorts & Casinos | 2.33% |
REIT - Diversified | 2.31% |
Insurance - Diversified | 2.07% |
Conglomerates | 1.97% |
Entertainment | 1.84% |
Paper, Lumber & Forest Products | 1.67% |
Information Technology Services | 1.56% |
Beverages - Alcoholic | 1.47% |
Agricultural Farm Products | 1.32% |
REIT - Retail | 1.31% |
Travel Services | 1.19% |
Internet Content & Information | 1.12% |
Furnishings, Fixtures & Appliances | 0.69% |
Travel Lodging | 0.60% |
Semiconductors | 0.46% |
Medical - Distribution | 0.19% |
Trucking | 0.14% |
Asset Management | 0.12% |
Financial - Credit Services | 0.07% |
Financial - Capital Markets | 0.04% |
Banks - Regional | 0.01% |